Android continues to be the most popular operating system in the world. It is used on a wide range of devices, from smartphones to tablets, and even in cafe automation systems. In fact, it is used by literally billions of devices. However, unlike Apple’s iOS, these devices are divided among various versions of the operating system. For example, the usage rate of Android 9 is still close to 11% today. The primary reason for this is the differences in how manufacturers handle updates. Fortunately, the latest data shows that this issue has been resolving. Android 13 is now the most popular version of the OS. Here are the details…
Android 13 Becomes Most Popular Version of OS, a Year After Release
When it comes to software updates, it wouldn’t be entirely wrong to say that Android smartphone manufacturers have been falling short. There are millions of phones developed by numerous different manufacturers, and they often struggle to meet specific standards when it comes to updating Android to different versions. However, Google and manufacturers have been working on solving this issue that has been bothering users for a long time. Recently, Google updated the Android version distribution statistics, revealing the progress in the industry.

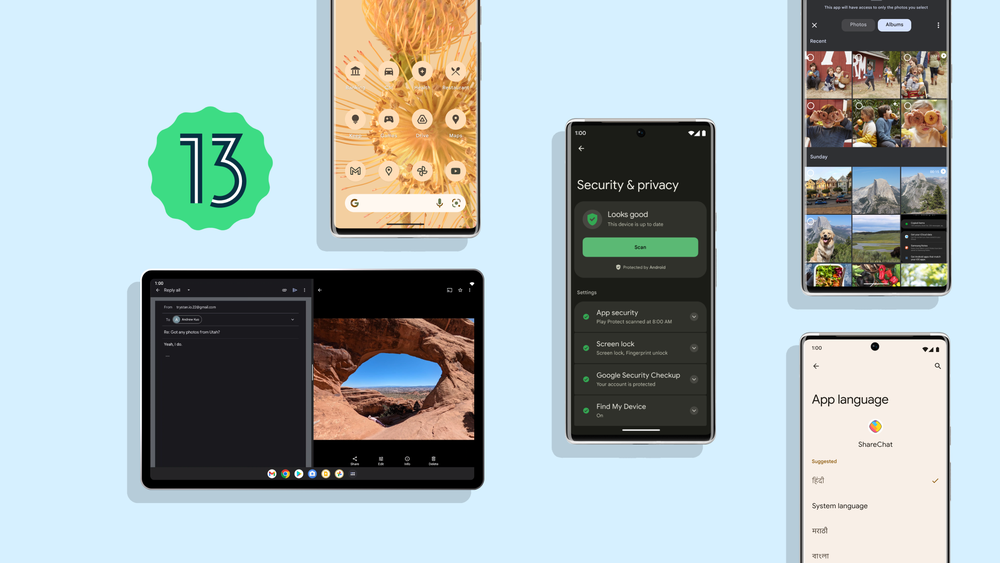
When we look at Google’s published Android version distribution statistics, we can see that Android 13 is now the most popular version, taking the top spot. The operating system has increased its market share from 15% to 22.4% since the last update in May. Considering that only five months have passed, this is a significant achievement. It is estimated that not only newly sold phones but also existing models in the market have received these updates.
In the second position on the list, we have Android 12, which has declined from 16.3% to 15.8%. The still quite popular Android 11 has also decreased from 23.1% to 21.6%. Unfortunately, Android’s most significant challenge remains its update process. Older devices often continue to be used for years without upgrading to the latest versions. This situation not only disappoints users but also creates security vulnerabilities. For those curious, here’s the rest of the list:
Android 13: 15% -> 22.4%
- Android 12: 16.3% -> 15.8%
- Android 11: 23.1% -> 21.6%
- Android 10: 17.8% -> 16.1%
- Android 9: 11.9% -> 10.5%
- Android 8.1: 6.1% -> 5.4%
- Android 8: 2.2% -> 1.9%
- Android 7.1: 1.5% -> 1.3%
- Android 7: 1.5% -> 1.3%
- Android 6: 2.3% -> 1.9%
- Android 5.1: 1.5% -> 1.2%
- Android 5: 0.3% -> 0.2%
- Android 4.4: 0.5% -> 0.4%
RELATED:
- Xiaomi 14 Pro vs Google Pixel 8 Pro: Specs Comparison
- Galaxy S20, Galaxy Note 20 will get Android 14 update after all
- Google Bringing a Fix for Android 14 Storage Access Issue
- Dasung Not-eReader 133 can serve as an Android tablet & E ink monitor at…
- Attention Android Users: Don’t Buy This Phone Unless You Want to Use It Forever
(via)


