Google has for several years released the Android distribution chart which shows the percentage of Android devices running each version of Android right from the oldest to the latest. Google released the Android distribution chart was in 2017 and provided an update in 2018 and then another updated chart in May 2019. Last year, tech enthusiasts had to rely on data from Porn Hub to get an idea of how the Android versions are distributed in December. We may never find out the true state of things now as Google has finally taken off all records, including the old data off the web.
Google initially designed the Android distribution chart mainly to aid Android app developers to make informed decisions on the “minimum” version of Android that their app can run on. However, it was becoming a sort of embarrassment to Google especially as older Android versions still control a large percentage.
EDITOR’S PICK: Xiaomi’s Aqara officially unveils its range of smart home products in the US
For instance, Android Marshmallow released in 2015 still has over 15% market share. That is mainly because most of the OEMs never bother to update their models to the next version. Rivals such as Apple could use the distribution chart data to brag about how they are better at pushing updates in a timely manner to iOS devices. We should add that there are models running Android OS that don’t necessarily need updating to the latest Android version such as digital signage. 
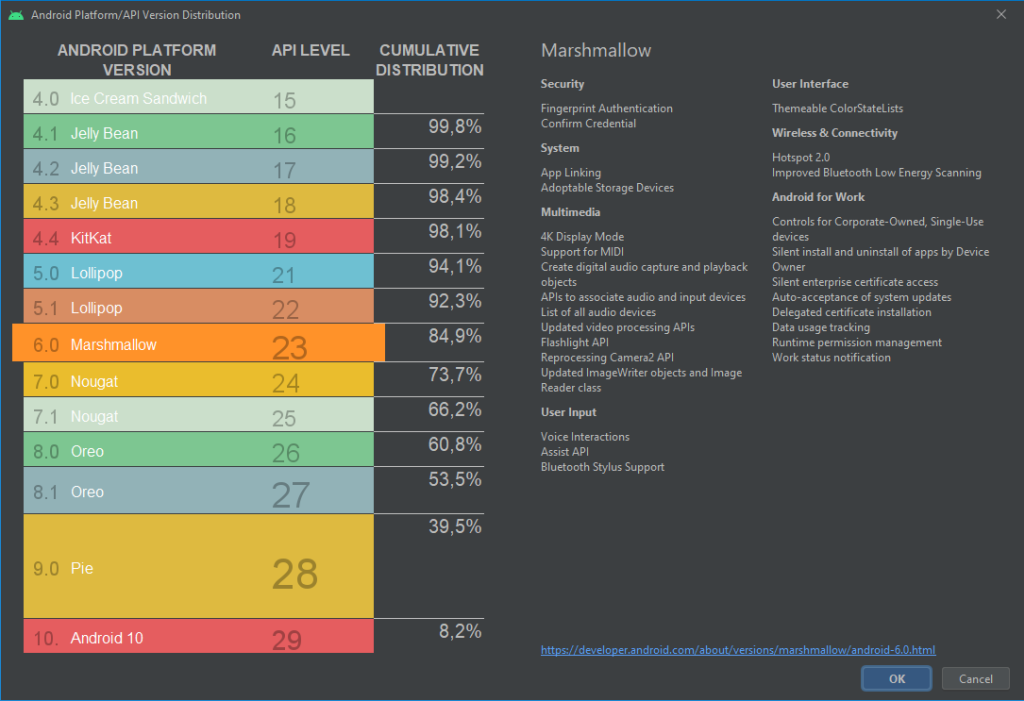
Presently, the Android Distribution chart landing page contains a short notice advising those interested in the distribution numbers to find them in Android Studio. The studio shows a “cumulative distribution” percentages instead of the pie chart we are used to and which is easier to understand. The chart shows there are models still running Android 4.1 Jellybean. Thus, developers would need to select the oldest version of Android that their app will run on and that will in turn trickle down to the newer versions. 
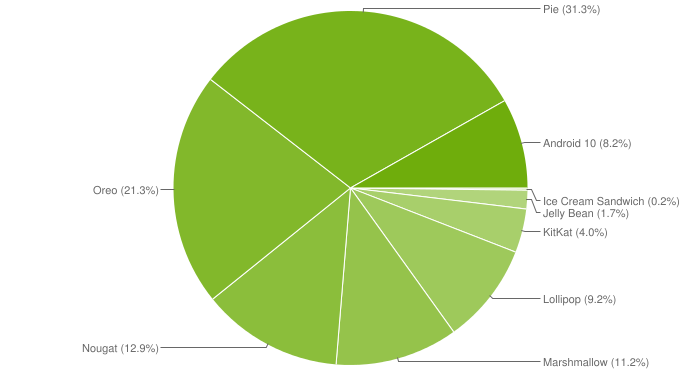
However, 9to5Google has created a pie chart created from the data Google provided. The chart shows that Android 10 has just 8.2% share of the market. On the other hand, last year’s Android Pie reached 31.3% which is the largest share which Android 8.0 Oreo comes in second with 21.3% market share. Check out the chart above.
UP NEXT: Best custom ROMs for Poco X2
(source)


