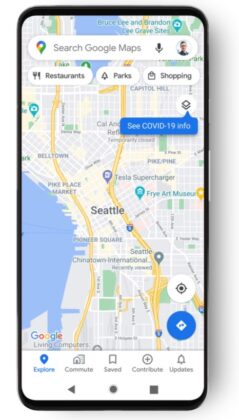
Google is constantly working to create awareness among people about COVID-19. It’s Google Maps has already has a COVID-19 alert, checkpoints. In fact, it has a section dedicated to the pandemic explaining the guidelines to be followed. And now, it has gone a step further to introduce a new layer, a tool that shows critical information about COVID-19 cases in a given area.

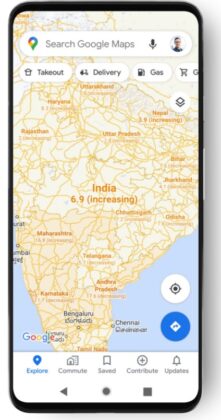
The new update will add a new “COVID-19 info” tab on the top-right corner. This is intended to help Google Maps users get access to data on the infections around them. Open Google Maps and Select Layers>COVID-19 info and it will reveal a 7-day average of COVID-19 cases. As per Google, this calculates the average per 100,000 cases in the selected area.
To make things easier, Google also has new color codes to indicate the amount of increasing/decreasing cases as shown below:
- Grey: <1
- Yellow: 1 – 10
- Orange: 10 – 20
- Dark orange: 20 – 30
- Red: 30 – 40
- Dark red: 40+
Editor’s Pick: Google Maps now lets users calibrate GPS with Live View
Google says through this distinctive color-coding, users can know what is the intensity of new cases around them. The data on trending cases will be available in 220 countries including their state, county, and city-level data wherever possible. However, this may be subject to delays as there are instances where cases have been reported late with few discrepancies.
Further, according to Google, the data that is shown is collected by sources from various Public Health Organizations like WHO, Government Health ministries along with state agencies and hospitals. Some of the legit sources include John Hopkins, the New York Times, and Wikipedia. It must be noted that some of them already help Google refine its search and display of COVID case information on Google Search. That said, the feature will start rolling out to users of both Android and iOS this week.
Up Next: Apple and Google may face trouble as startups seek probe on their in-app purchase system


